NEWS ANALYSIS
10
infrastructure
investor
april
2014
Last year was unquestionably the year of energy
deals. According to data compiled by
Infrastructure
Investor
Research & Analytics, the energy sector
accounted for eight of the top ten global infrastruc-
ture deals in 2013.
With the $9 billion Nghi Son Refinery project
in Vietnam at the top of the tree, energy racked
up $114 billion worth of deals compared with the
$70 billion for transport.
A quick glance at the top ten deals right will
be all that’s required to see that, so far this year,
things are panning out rather differently. While
the largest deal (Lundin Petroleum in Norway)
is once again claimed by energy, the next five are
all transport deals – including the likes of SH 99
Grand Parkway in the US and the Porterbrook
Rail refinancing in the UK.
Of course, with just three months completed
so far, it’s early days and a lot can change in the
remainder of the year. That said, themandated lead
arranger table already has a fairly familiar look about
it. The strong Japanese influence in the wake of the
global financial crisis continues to be evident, with
SMBC in first place and Mitsubishi UFJ in sixth.
Interestingly, however, the impact of theAustral-
ian banks – whichmade their presence felt increas-
ingly strongly during 2013 – has been maintained
in the early months of this year. Australia and New
Zealand Banking Group and Commonwealth
Bank of Australia will be pleased to see their names
appearing in second and third places respectively.
Last year saw Western Europe come from
behind to overhaul Asia Pacific as the world’s most
active region for infrastructure projects. The first
three months of 2014 indicated that another close
race was in prospect, with Asia Pacific claiming
a 31.64 percent share of global deals during the
period and Western Europe 31.47 percent.
TheUS takes the crown as the busiest individual
market, with more than $7 billion, ahead of Aus-
tralia in second.
n
Deals such as SH 99 and
Porterbrook suggest the energy
trend may be bucked
Transport sector hits accelerator
l e a g u e
t a b l e s
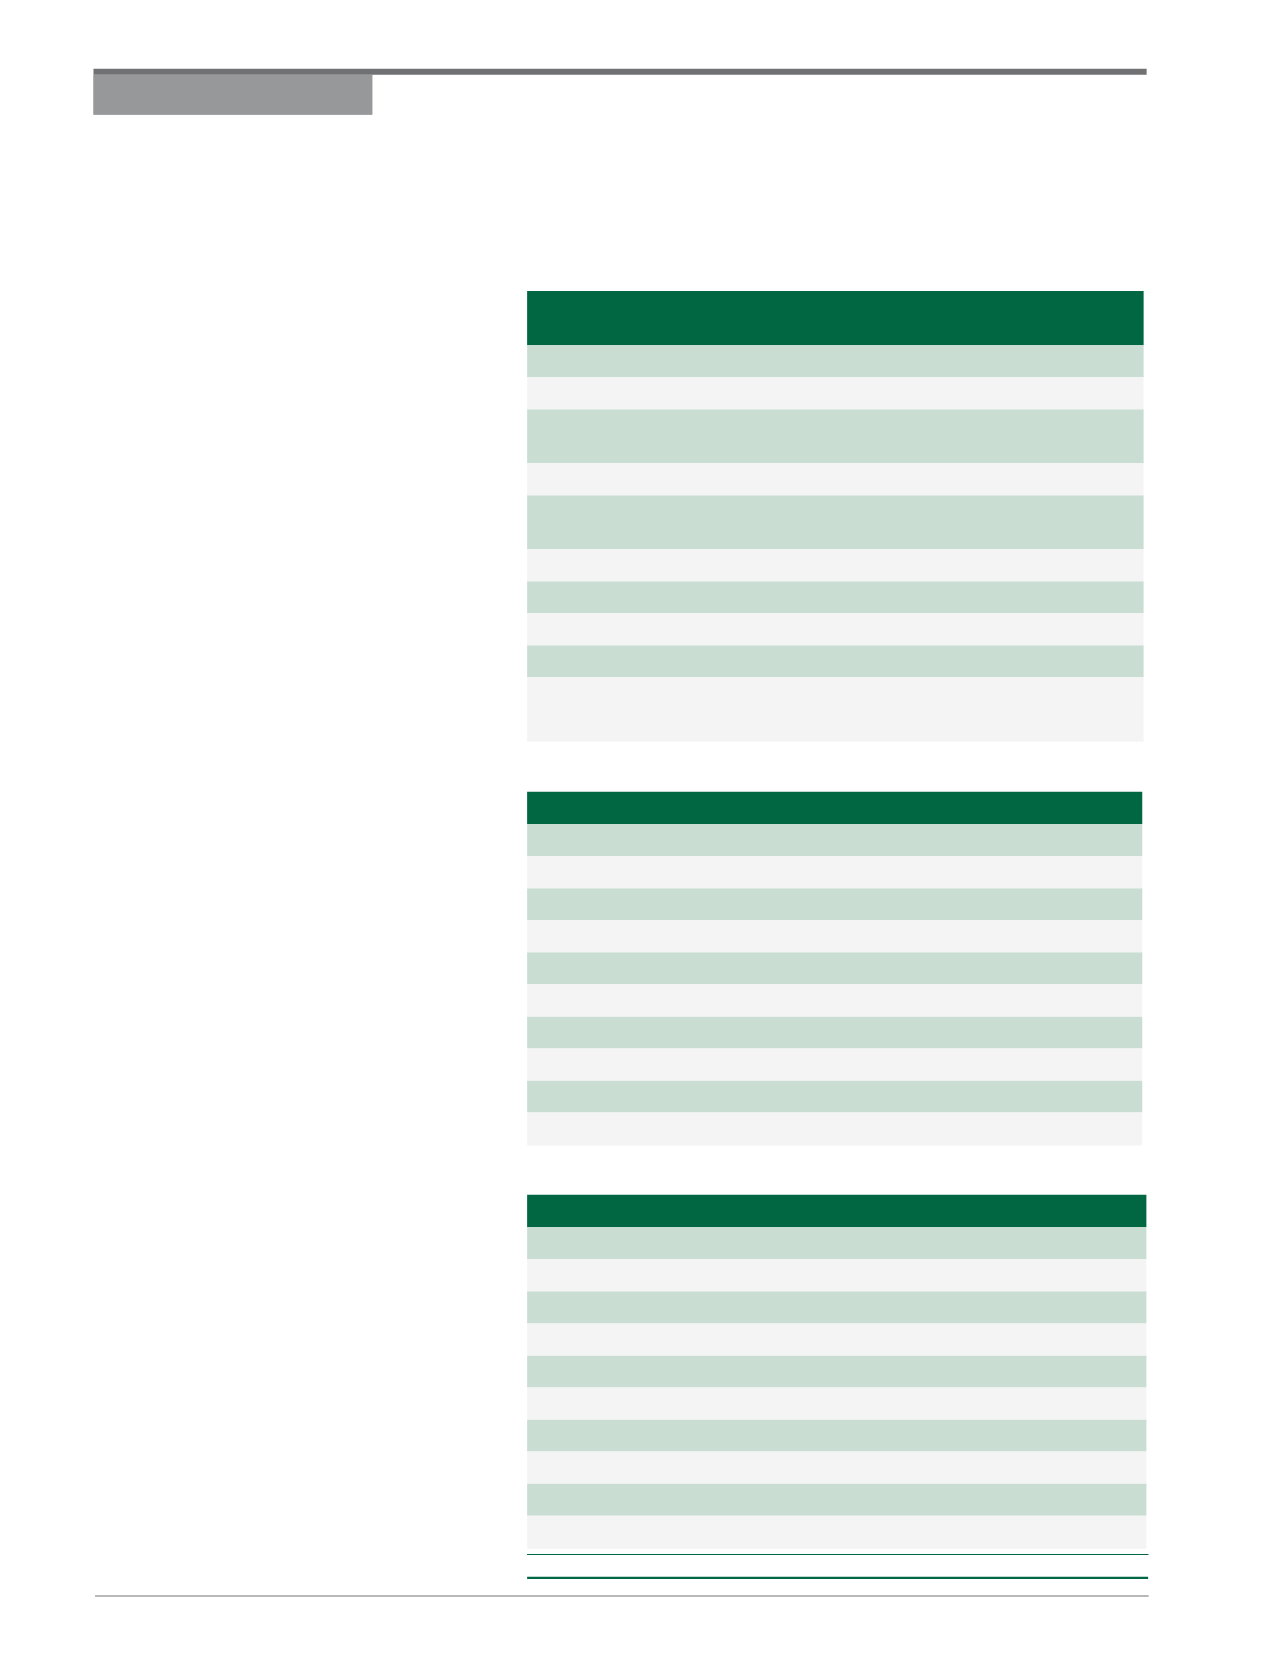
Q1 2014: TOP 10 INFRASTRUCTURE PROJECTS
Q1 2014: TOP 10 MANDATED LEAD ARRANGERS
Q1 2014: TOP 10 COUNTRIES
Project
Financial
close
Value
($m)
Nationality
Sector
Lundin Petroleum
12/02/2014 4,000.00 Norway
Energy
SH 99/Grand Parkway Project
06/02/2014 2,913.40
US
Transport
Porterbrook Rail Finance
Refinance
21/03/2014 1,913.00
UK
Transport
Newcastle Coal Terminal Project
13/03/2014 1,690.62 Australia
Transport
Queensland New Generation
Rollingstock Project
17/01/2014 1,615.79 Australia
Transport
Carrix Inc Refinancing Project
07/01/2014 1,545.00
US
Transport
Jamshoro Power Project
12/02/2014 1,500.00 Pakistan
Energy
Project Kosmos
14/03/2014 1,500.00
Ghana
Energy
A11 Bruges Bypass PPP
20/03/2014 1,472.49 Belgium
Transport
South Korea Gas and Steam
Power Plant
09/01/2014 1,357.92 South Korea
Energy
RANK MANDATED LEAD ARRANGER
VALUE ($m)
SHARE (%)
1
Sumitomo Mitsui Banking Corp (SMBC)
1,677.92
10.79
2
Australia and New Zealand Banking Group (ANZ)
1,023.05
6.58
3
Commonwealth Bank of Australia (CBA)
1,017.14
6.54
4
Credit Agricole SA
591.81
3.81
5
Societe Generale
528.9
3.40
6
Mitsubishi UFJ Financial Group
517.07
3.33
7
Kreditanstalt fuer Wiederaufbau (KFW)
432.53
2.78
8
ING Group
423.36
2.72
9
BNP Paribas
401.74
2.58
10 Groupe BPCE
358.49
2.31
Country
Value ($m)
Share (%)
US
7,180.50
17.07
Australia
4,686.79
11.14
Norway
4,237.75
10.07
UK
3,570.25
8.49
India
2,160.39
5.14
Pakistan
1,637.01
3.89
Ghana
1,500.00
3.57
Belgium
1,472.49
3.50
South Korea
1,357.92
3.23
Vietnam
1,174.23
2.79
Source
: Infrastructure Investor Research & Analytics


